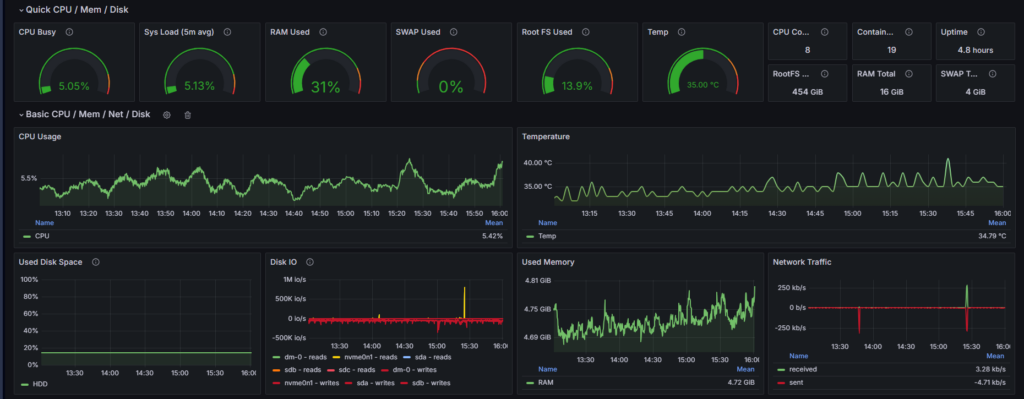
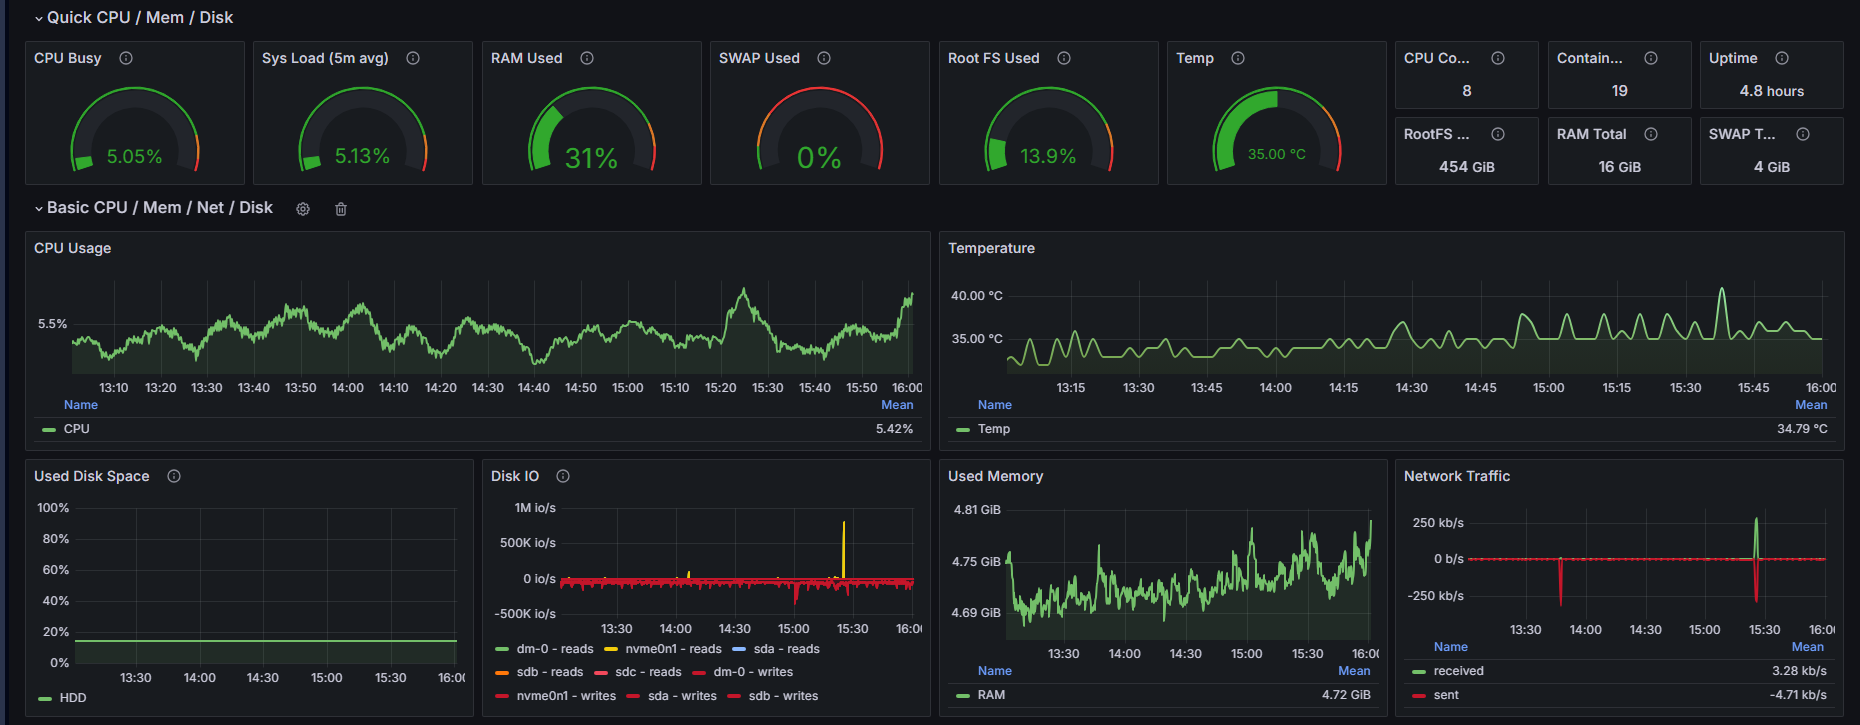
On my server, monitoring is not a separate dashboard project; it is part of the way I run the platform every day. Before and after important changes in WordPress, nginx, or Docker services, I validate health, behavior, and user impact as one connected workflow.
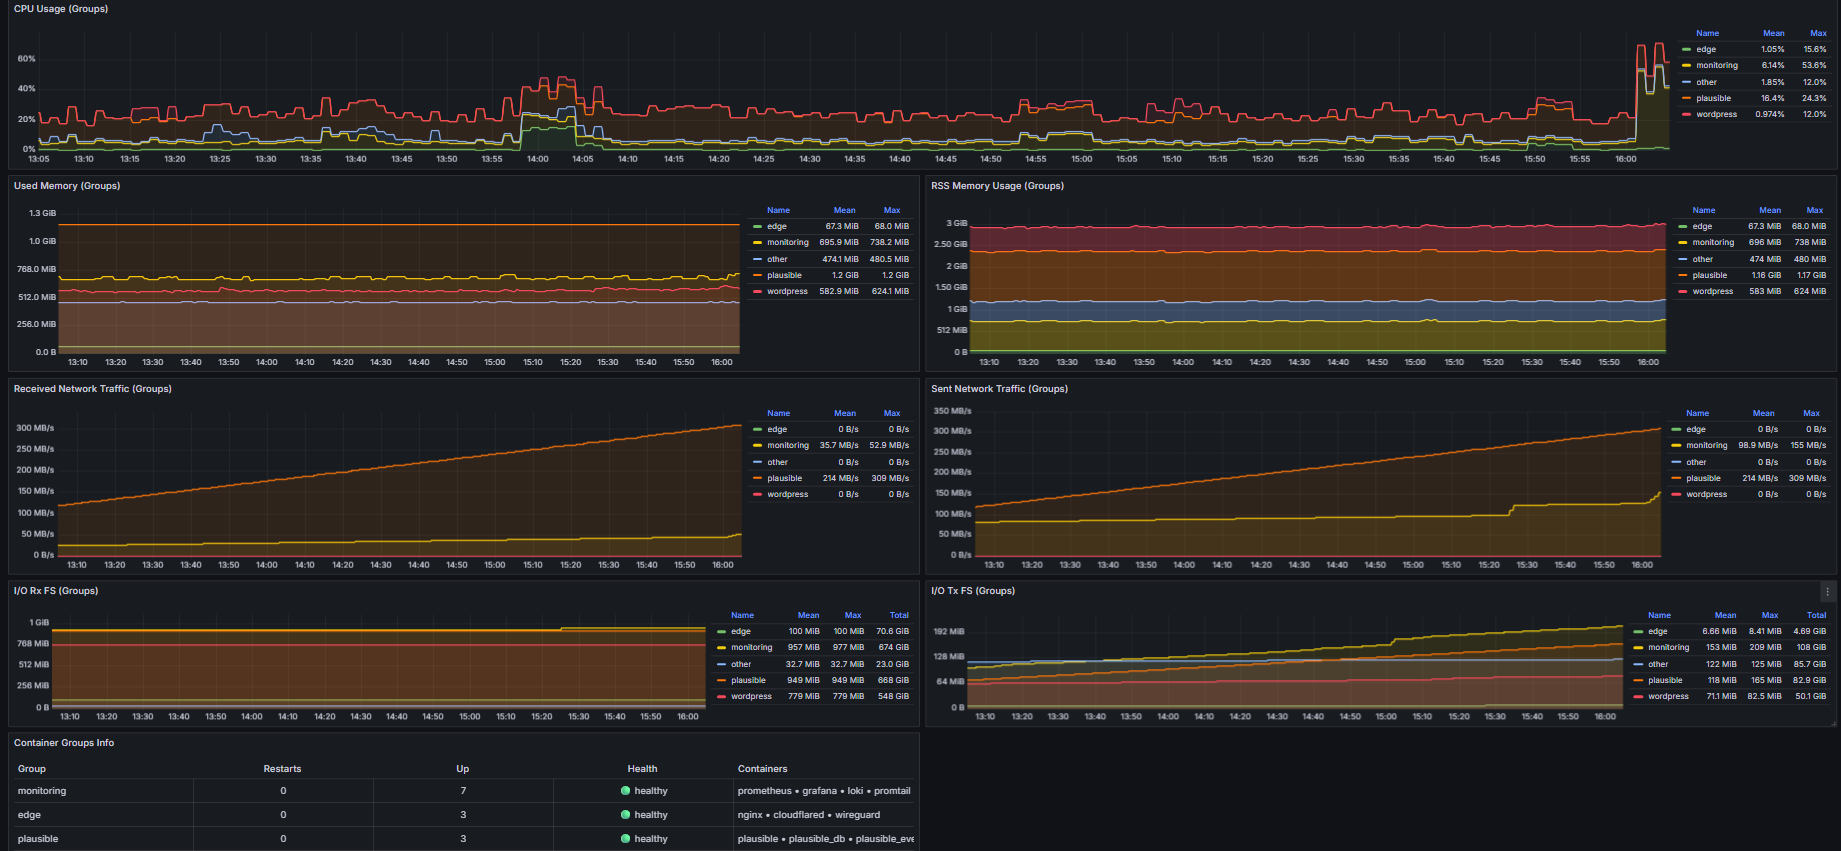
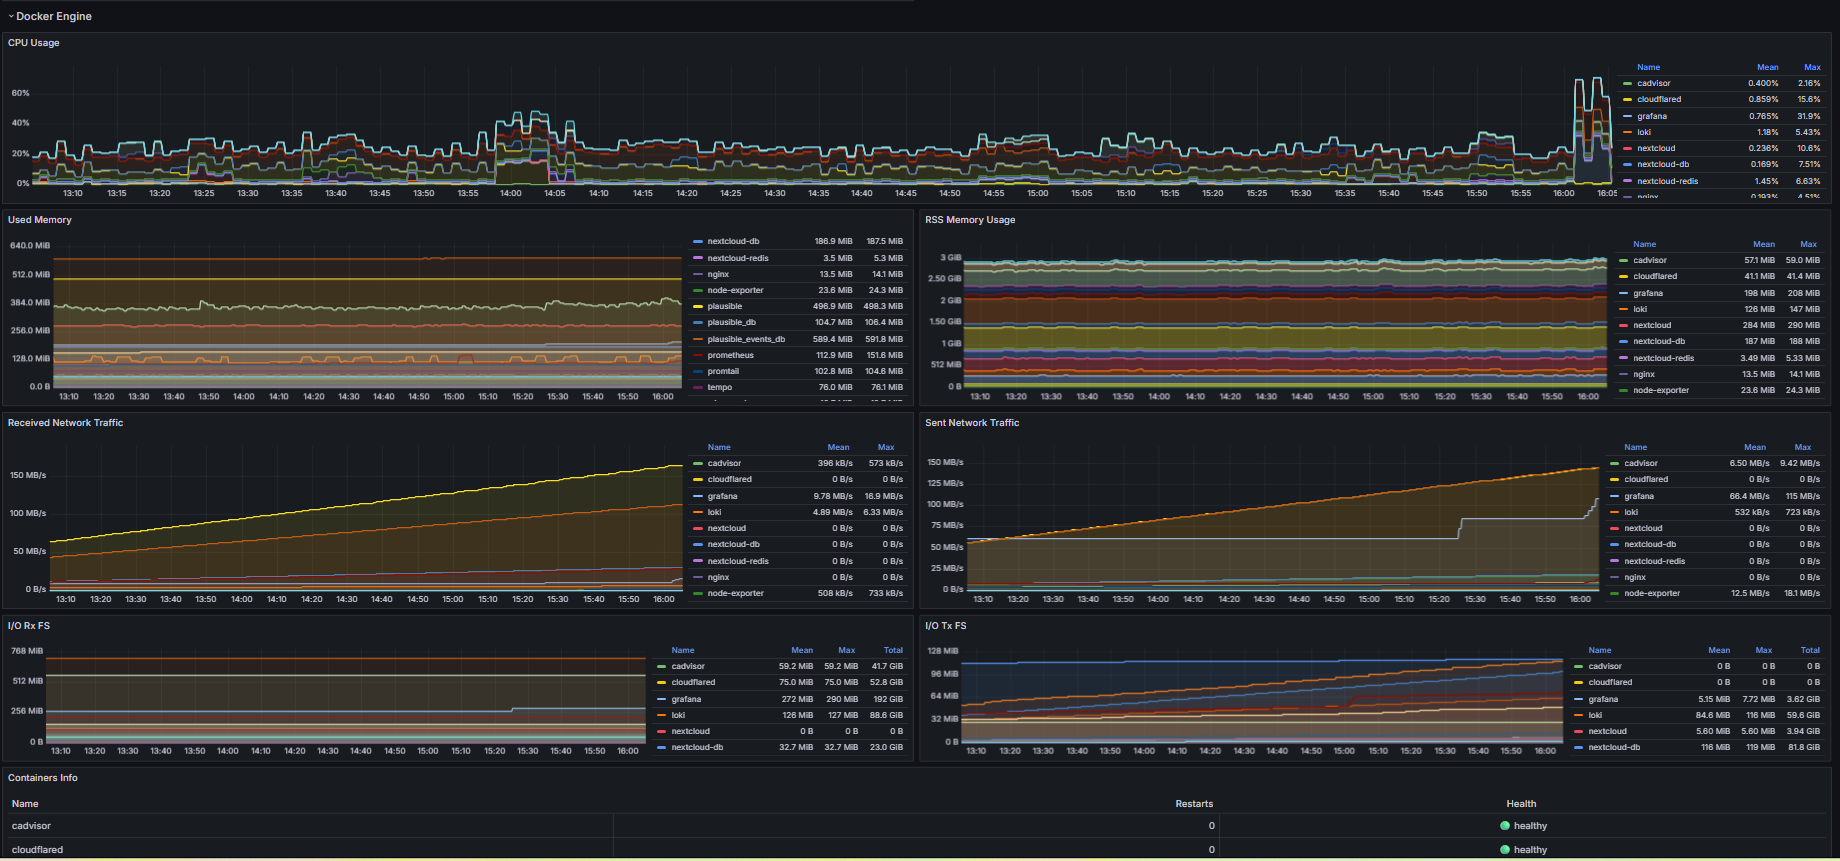
At infrastructure level, Prometheus collects metrics every 15 seconds, Node Exporter gives host visibility, and cAdvisor adds container-level telemetry. For logs, Promtail ships both Docker JSON logs and nginx logs into Loki. Tempo is enabled for OTLP traces when I need deeper request-level visibility. Grafana sits on top of this stack with provisioned data sources, so metrics, logs, and traces stay connected instead of living in separate tools.
Plausible + WordPress: how I configured it
For analytics, I run Plausible Community Edition in Docker with PostgreSQL and ClickHouse. On the WordPress side, I use the Plausible plugin in self-hosted mode for macarare.com, and load the tracker as a first-party script from /js/pa-...js. Events are sent to /p/event, which is proxied by nginx to Plausible ingest. I also keep compatibility paths for Plausible plugin API and tracker resources behind nginx, so WordPress integration remains stable after cache or plugin changes.
In practice, this data helps me in three ways. For monitoring, I can quickly spot real traffic anomalies after a deployment, not just infrastructure-level issues. For debugging, I can correlate drops, 404 spikes, search/form behavior, and endpoint activity with logs and service metrics to isolate root cause faster. For analysis, I use Plausible to validate if navigation, content structure, or SEO changes actually improve user flow instead of guessing from intuition.
How I use this in operations
When something looks wrong, I start from external symptoms (uptime and traffic), then move into metrics/logs, and finally confirm recovery by watching events and pageviews normalize. This loop makes the stack easier to maintain and reduces blind troubleshooting.
External Monitoring
Having a great dashboard is very useful, but it becomes pointless if the server loses connection. To ensure proper monitoring and receive alerts when my website or services go down, I configured a free Better Stack account to regularly check each service with periodic pings. If any service stops responding, Better Stack sends an alert email to the mail server hosted on my home server.